Biodiversity At Scale
Connected data doesn’t just move between systems. How multiple datasets combine to deliver biodiversity insights at supply chain scale.
How connected data turns hundreds of farms into one clear picture
In our previous article, we explored why APIs have become one of the most important topics in agricultural data.
APIs allow information to move automatically between organisations, replacing manual spreadsheets and disconnected systems with trusted, continuous data flows. That data connection is only the beginning.
The real value comes from using those connections to answer questions that would otherwise take months of manual work.
An example being biodiversity.
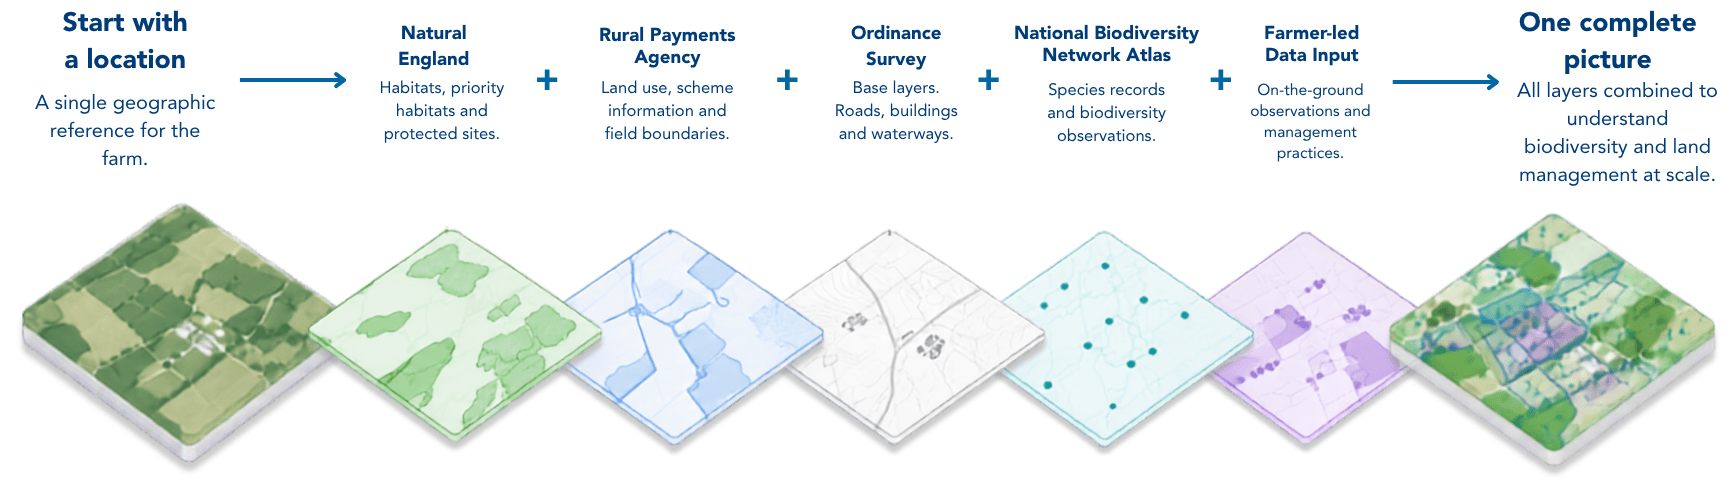
By using a single location as the common reference point, whether that’s a postcode, Single Business Identifier (SBI), or another geographic identifier, multiple independent datasets can be connected automatically. Instead of looking at each source in isolation, they become one joined-up view of the farm.
That’s where biodiversity at supply chain scale becomes possible.
Bigger, Better and More Connected
In the Lawton 2010 ‘Making space for nature’ review, improving on-farm biodiversity can be summarised as requiring bigger, better and more connected ecological networks. But to know what to increase, what to improve and what to connect you need to first know what is there in the first place. For a food manufacturer or processor working with hundreds of growers spread across multiple counties, building that picture manually is a challenge to say the least.
Connecting Biodiversity Data Automatically
Using API connections to trusted external data sources, we are able to pull verified and up to date data from organisation such as Natural England, Rural Payments Agency, Ordinance Survey, National Biodiversity Network Atlas and others.
Because every dataset references the same physical location, they can be combined into a single biodiversity profile for each grower.
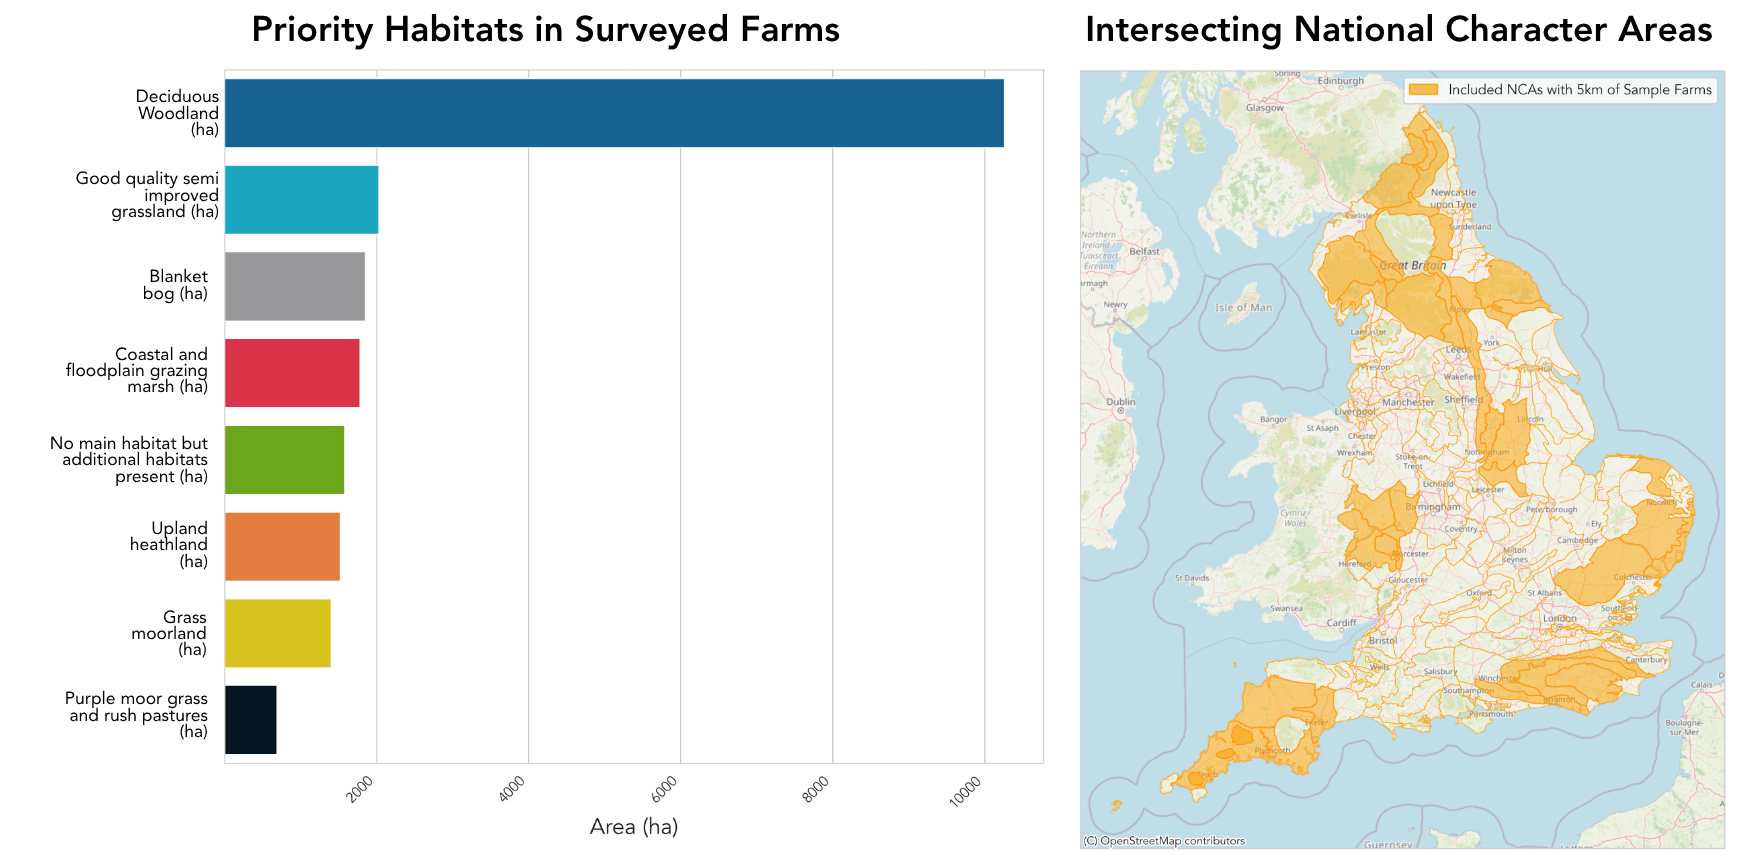
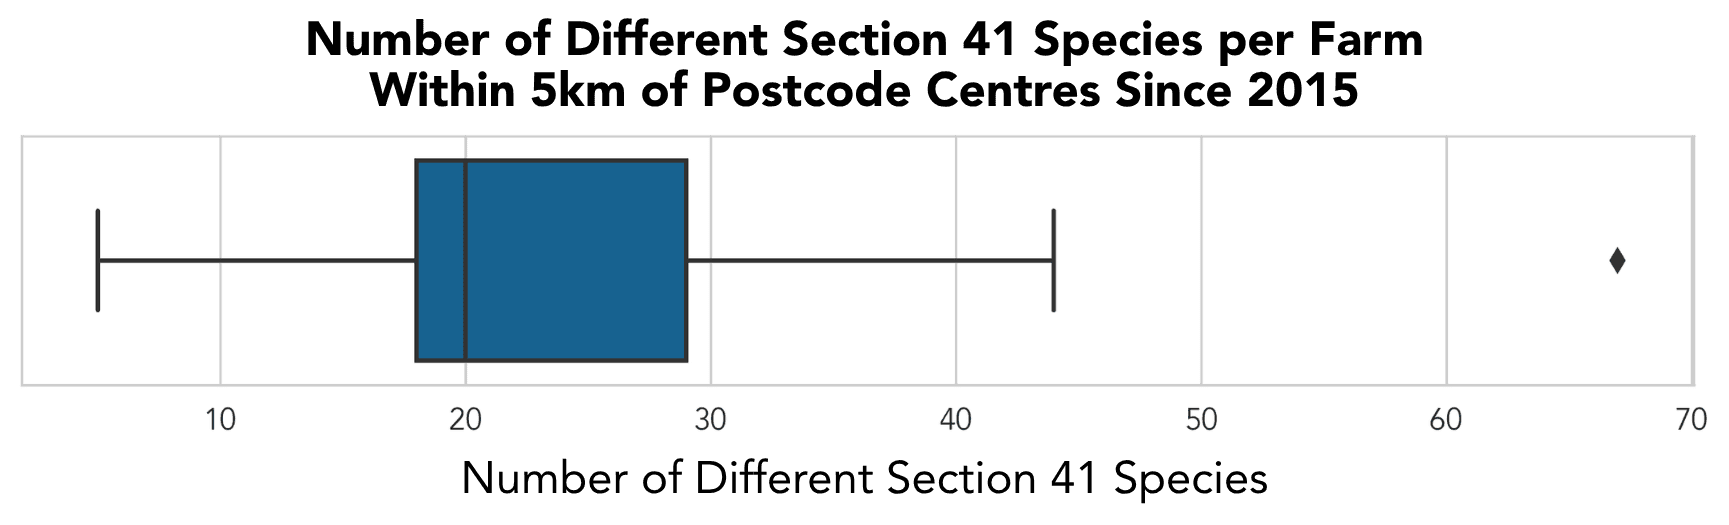
Those individual farm profiles can then be aggregated across an entire supply chain, giving organisations their first comprehensive view of the habitats and species they may be influencing, both positively and negatively.
Rather than analysing hundreds of farms individually, biodiversity can be understood at supply chain scale.
Turning Data into Decisions
Understanding what’s there is only the first step.
The information can be delivered in whatever format best suits the organisation:
Executive reports
Interactive dashboards
API outputs into existing systems
Growers can be given access to their own information, alongside anonymised benchmarking against the wider supply chain, helping improve engagement while maintaining privacy.
The result is a shared understanding of biodiversity across the network, providing evidence needed to prioritise future action.
Minimal Viable Data
One of the advantages of connected data is that very little information needs to be collected manually.
For an initial habitat and species assessment, all that’s required is a geographic reference for each grower. A postcode or a Single Business Identifier (SBI).
Using an SBI unlocks additional datasets, including:
· land use
· hedgerow information
· field boundaries
· Agri-Environment Scheme participation
These datasets providing that greater understanding of habitats already being managed and can also be linked with other tools such as our Sustainable Farming Incentive Calculator, helping growers optimise environmental schemes alongside commercial performance.
Bigger, better and more interactive
Improving biodiversity on farm at scale isn't simply about mapping biodiversity; its about making ecological networks stronger over time.
Not everything needed to assess habitat quality exists within public datasets.
Management practices such as:
· supplementary winter bird feeding
· cover cropping
· companion cropping
· flowering break crops
All influence biodiversity but need collecting directly from growers.
YAGRO Exchange allows these surveys to be configured with appropriate permissions and validation, making it straightforward to collect information consistently across an entire supply chain.
Combined with the automated datasets already available, organisations gain a much richer understanding of both habitats and the management decisions influencing them.
The results can then be explored through reports, dashboards or interactive mapping, helping organisations target investment, measure progress and develop biodiversity strategies based on evidence rather than assumptions.